
The key to creating compelling infographic design lies in the intelligent fusion of the latest and most relevant graphic design principles and technical know-how. Keep this in mind and any type of visual content you create either for digital or print consumption will bring you and your business only positive results.
In the list below, we have curated some of these design tips and trends that can be useful for those who wish to create impactful infographics. Read each tip and assess how you can apply them into your own design creation process.
1. Plan your content and layout
Perhaps the most important tip when it comes to designing an infographic is having a plan. As the content creator, you need to decide on what specific pieces of information to include in your infographic. You also need to choose a layout style that will best help present your topic. At this preparatory stage, you may even have to create a rough draft or outline of how your infographic will look like.
2. Tell a story
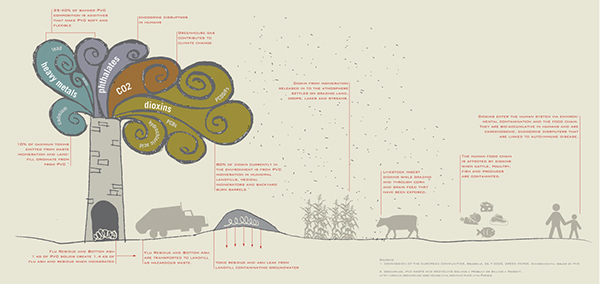
Another important tip when designing an infographic is to remember that you are still creating an informational piece of content. It is important to come up with a unique and compelling narrative. This way, people are more inclined to read the entire infographic and to take action after reading the visual aid.
3. Apply data visualization techniques
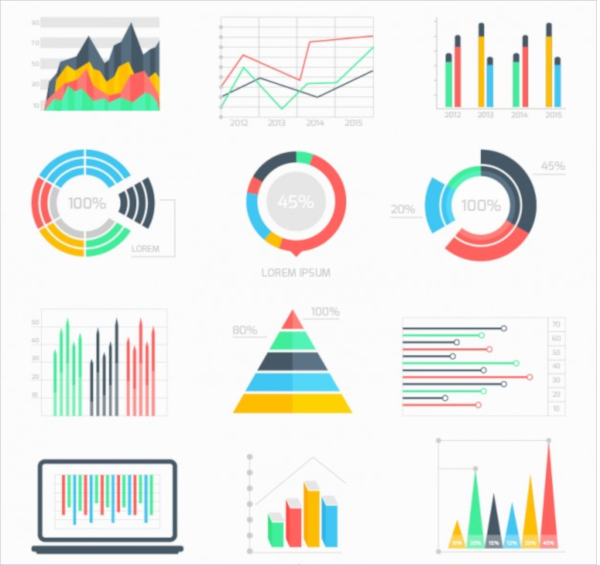
After making sure that your infographic follows a good narrative or storyline, the next consequential step is to use different data visualization tools. Remember, infographics mainly are content presented in a highly visual manner. Your infographic design should incorporate as many visual elements to help aid readers in understanding the topic you are talking about.
Examples of data visualization tools are graphs, tables, charts, graphic illustrations, icons, and even comic designs. Use one or a combination of these visualization tools and your final output is guaranteed to remain in the minds of your readers or audience.
4. Choose a complementary color scheme

As with any graphic design project, it is important to choose an enticing and appropriate color palette. Remember, color is one of the first things that people see when they look at something. By applying the basic principles of color theory to your infographic design project, you are more likely to succeed in converting readers of your infographic to customers.
5. Minimize text, focus on images and illustrations
We have mentioned earlier that infographics are created as a visual tool to summarize lengthy or statistics-ridden articles or topics. Therefore, any infographic that you design should not include walls of text or long passages of quoted statements and research findings. Instead, focus on the different ways that you can present all these ideas and facts visually.
Always remember to find a simpler way to write a statement and then transform this into the simplest illustrations or images.
6. Find your infographic’s voice
In addition to making sure that your infographic design follows a core narrative or story, one of the most important things you can do when creating them is to make sure that your infographic design has a unique voice.
Finding and/or choosing a voice for any kind of graphic design project may also be likened to choosing the tone or emotion you wish your project will project. To illustrate, if you are creating an infographic about the top ways to decrease one’s carbon footprint, you may choose a laidback but knowledgeable tone or voice. This way, you can communicate your message in a friendly and non-judgmental manner. On the other hand, if, for example, you are creating an infographic on how to create your own computer for another client, you may have to take on a more formal and professional tone.
Choose a voice or tone that will best match the topic, the approach, and the messaging you wish to convey.
7. Choose good font styles and typefaces
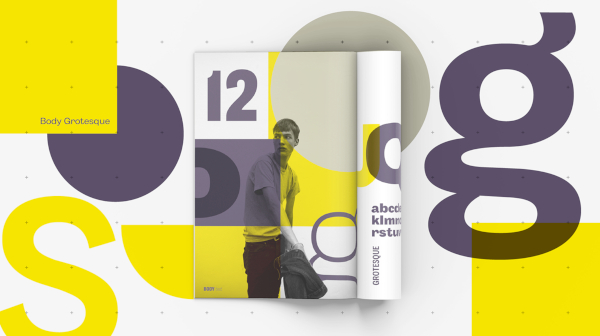
Select clear and bold font styles or typefaces. This will make your infographic more readable and clutter-free. As a rule of thumb, only use font styles that belong to the same typeface family. This way, your final design output will not look splintered and, in effect, useless in communicating the message you are trying to convey.
8. Take advantage of negative space

When creating an infographic, you are bound to include images, illustrations, cool logos, and other graphics to tell a story in a better. Negative space (or the empty space surrounding any visual element in a design project) is applied when you do not overcrowd your infographic design with unnecessary colors, shapes, and other elements. It helps show visual balance by allowing all the design elements to breathe and stand on its own.
9. Apply interactive effects, if possible
An emerging trend in infographic design is the use of interactive tools within an infographic. Examples of which are embedded polls, animations, clickable images, and links redirecting to more activities that the reader can participate in. If you are creating an infographic that will be posted online on its dedicated website or blog page, then adding more interactive features may work for you.
10. Indicate your sources
Infographics often are a collection of data and images from various research studies, articles, and sources found online and offline. Make sure that you credit these sources accordingly by listing them down at the end of the infographic. You do not have to include the source list on the actual infographic image file. What you can do instead is add the list of sources on the original article or blog post that contained the infographic. This way, anyone who looks up the origin of the infographic will see this source list.
In a world with decreasing attention spans, making use of tools like infographics can be a boon for your business’ or organization’s online presence and influence. Study and apply any or all of the tips and trends that we have shared above. Also, remember that creating a good infographic design is not the end. You need to develop a concurrent marketing campaign (whether online or offline) to help spread the word about your infographic and, subsequently, your brand. There’s a lot more to do, so get started as soon as possible until you learn how to create the most compelling infographic for your business or organization.
Related Posts
The Best New Portfolio sites, March 2023
Best Poster Designs 2023: Ideas and Tips
Hit and Miss of Olympic Logo Designs from 1924 till 2023
10 Iconic Moments Photographed in 2023 Rio Olympics
Top 5 Logo Design Trends of 2023
2023 Packaging Design Pentaward Winners
Digital Design Trends for 2023
Best Travel Apps for 2023
9 Script Fonts for 2023
10 Best Free Fonts for 2023
10 Best Mobile Games of 2023
Logo Design Strategies for 2023
Top 9 Web Design Trends for 2023
10 Most Popular Graphic Design Trends of 2023
Visual Design Trends to Look Out in 2023